


Action area 2: Integrated Infrastructures
To see all the measures to be implemented, click here.
Sensor deployment in the 22@ district of Barcelona
Within GrowSmarter, measures are being carried out to develop an air quality model at the urban-scale using Computational Fluid Dynamics (CFD) simulations. In order to provide real-case inputs for the operational air quality nowcasting and the short-term forecasting of the CFD models, a set of monitoring sensors will be deployed in an initial pilot area in Barcelona. The monitoring nodes, composed of wind and air quality sensors, will be installed in 4 Smart Towers in the 22@ district. This use case will also include vehicle counting equipment for emission monitoring purposes.
An urban-scale air quality model - why?
Air quality and associated impacts on public health are matters of growing concern in many urban areas. Public administration and health agencies are tasked to monitor the quality of air and, eventually, to make model forecasts to assist the adoption of reactive measures and to warn the public of air pollution that could affect vulnerable groups of citizens.
Urban-scale pollutant dispersion models require of two critical inputs: high-resolution wind fields near urban-scale morphologies (buildings) and pollutant sources (mainly derived from vehicle combustion) through sensors and emission inventories. Today, the increase in computational capabilities is making it possible to envisage a near-future scenario in which Computational Fluid Dynamics (CFD) models will be used to simulate urban-scale winds and pollutant dispersion operationally. In this scenario, the massive deployment of low-cost sensors for monitoring wind and the concentration of critical pollutants will be critical.
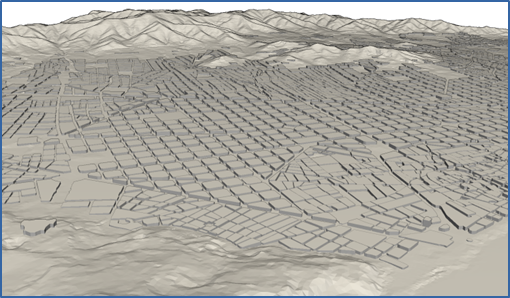
Mesh of Barcelona, obtained from LIDAR data, topography and cadastre data
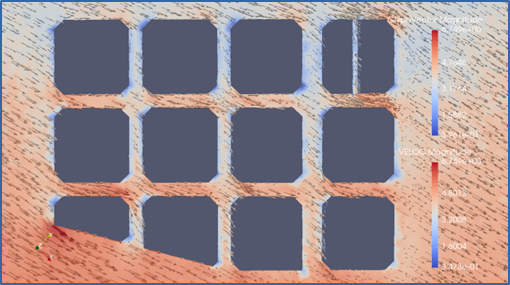
Results for wind field (speed and direction) obtained from CFD simulation
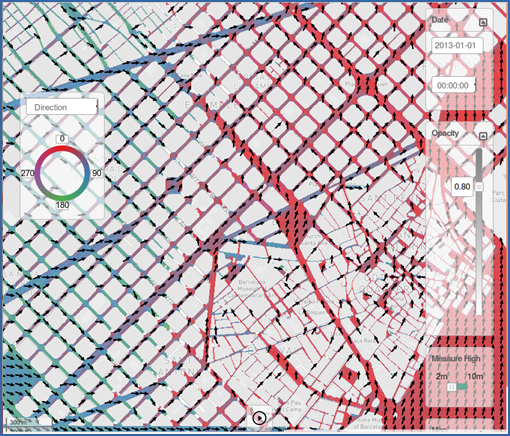
Web-based graphical user interface for visualisation of air quality results
Sensor deployment at 22@ district of Barcelona
Using the city of Barcelona as a test bed, this use case will deploy a low-cost sensor network to extend the current monitoring network of environmental sensors to selected urban areas of Barcelona. Real-time data will be used to initialise and validate an in-house CFD-based high-resolution (tens of meters, hourly output) urban-scale air quality model before its operational implementation. This system is being developed at the Barcelona Supercomputing Center (BSC) in a joint collaboration with the Barcelona City Council (IMI - Municipal Institute of Information) and the CAPTOR project, who provides the monitoring nodes that integrate the air quality and wind sensors.
The monitoring nodes for wind and air quality will be installed in 4 GrowSmarter Smart Towers in the 22@ district, also including vehicle counting equipment for emission monitoring purposes.
The use case will deploy a monitoring system for:
- Wind field (speed and direction),
- Air quality (NO2 and O3),
- Flow of vehicles (vehicles per minute).
- a Davis anemometer for wind direction and velocity
- several (up to 3) NO2 MOX sensors
- several (up to 3) O3 MOX sensors
- vehicle sensor to detect flow of vehicles
- Introduce a more efficient and effective freight transport system in the city centre,
- Analyse the administrative management of a public concession,
Analyse the business model of the service, - Analyse the reduction in CO2 and vehicle kilometres due to shift from conventional vehicles to electric bikes, and
- Test a new sensor system to measure pollutants and other environmental parameters using the bicycles of the service.
Each monitoring node will be composed of an Arduino node, which have been developed as part of the Horizon 2020 CAPTOR project, and integrating several sensors on a single device. This control hardware node is in charge of monitoring, management and post-processing of raw data coming from the following integrated sensors:
The environmental Arduino nodes will be deployed in the 22@ district and are self-contained packs that are designed to be installed on public street lights and poles at a minimum height of 5 meters to avoid vandalism. All the devices in this pack are designed to be long-lasting and highly durable to reduce maintenance. This installation pack is composed of the components shown in below:
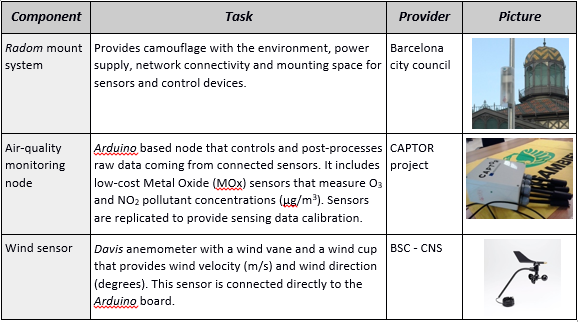
Components of the Arduino pack
The collected data will be sent to the GrowSmarter platform through the GrowSmarter API. The data will be used by the air quality monitoring software (nowcasting) developed by BSC-CNS that can predict wind fields in the streets with a resolution of 10 metres and 1 hour, and gas concentration with resolution of 10 metres and 1 hour. These resolution values are beyond the state of the art in air quality modelling for nowcasting.
Moreover, the sensing data information and the sensor-derived nowcasting maps will be offered as Open Data to third parties through the GrowSmarter platform so that consumers of these environmental data can use this information to provide environmental monitoring services.
Benefits for GrowSmarter
This use case is a clear example of synergies gained from integrating infrastructures of GrowSmarter: The Smart Towers will provide support for the monitoring nodes and provide communication infrastructure, while the GrowSmarter platform will provide the required data storage for the collected data. The air monitoring software is an example of a service developed on top of the GrowSmarter platform that will provide monitoring services. Moreover, this use case is an example of collaboration among different entities and projects beyond the GrowSmarter project.
Action area 3: Sustainable Urban Mobility
To see all the measures to be implemented, click here.
First results on the microdistribution of freight in Barcelona
In January 2017 the microdistribution platform became operational. The service is offered by the company Vanapedal. The municipality of Barcelona has leased a public space to the company, which is obliged to be neutral in the market and work with any logistics operator willing to use the service.
The main objectives of the measure are to:
The Last Mile Operator Vanapedal offers different services, the most relevant of which is the distribution of parcels and packages from other carriers to their final destination. Carriers bring these items to the microplatform which is conveniently located close to the city centre. These are then transferred to electric bicycles and tricycles. The last mile is then performed by drivers from Vanapedal following their established routes. Parking and access regulation do not apply to bicycles, so no delivery time window restrictions affect the distribution.
The service has been running since January 2017 from the Estació de França location with success, although the market is difficult to reach since there are also competitors and some logistics companies have begun operating their own last mile deliveries using sustainable modes of transport.

Location of the microplatform at Estació de França
Currently, up to 9 bicycles are being used in daily operation. The company gathers all business information of their operations including the daily number of deliveries and pick-ups, the number of kilometres covered and the time needed to cover all routes. This information is being collected monthly and the first results of the analysis of this information have been made. During the first three months of operations, 23,000 journeys have been performed and an increase in the daily number has been noted.

Average daily number of journeys
In February, the average distance covered was of 65.5km/day, while in March this figure increased to 160km/day due to the introduction of three more tricycles.

Km performed by all bikes daily between January and March 2017
Also, the effectiveness of the deliveries is being monitored. So far, the average percentage of successful deliveries has been 92.73%. This value has increased over time, but it is seen as very good compared to conventional carriers.

Evolution of the daily effectiveness of deliveries
The next step is to continue analysing the data obtained from the operator of the microplatform and compare it with the data obtained from the sensors that have been installed in three bicycles that offer further information such as the routes followed or the concentration of contaminants.
The last step of the process will determine how much traffic and CO2 this measure has reduced. This will help to encourage other cities to implement similar last mile services.
| Discussed in this blog Solution 8: Big data management Solution 9: Sustainable delivery |
|---|
 Gonzalo Cabeza
Site Manager, Barcelona
For the previous blog post, click here